Basic SWEET utilization from command line
From the SWEET’s root directory, call
$ . ./activate.sh
Cleanup
$ make clean
Compile
Compile PDE_SWESphere2D program
$ scons --program=programs/PDE_SWESphere2D
Run
Run the program using
$ ./build/programs/PDE_SWESphere2D_COMP_plspec_pldeal_spspec_spdeal_fft_thomp_release -M 128 --timestepping-method="ERK(ln, order=4)" --dt=300 --benchmark-name=three_gaussian_bumps -t 129600 -o 129600 -v 2
Here, the meaning of the parameters is as follows:
-
--timestepping-method="ERK(ln, order=4)"Use 4th order (classical) Runge-Kutta explicit time integrator (ERK(…) with order=4) on the linear and nonlinear term (ln)
-
--dt=300Use a time step size of 300 -
-M 128Spectral resolution of 128
-
--benchmark-name=three_gaussian_bumpsChoose benchmark with three gaussian bumps
-
-t 129600Simulation time in seconds. Run for 1.5 days.
-
-o 129600Output simulation data each 1.5 days (Here, at end of time step).
-
-v 2Be a little bit more verbose
Plotting
You can plot the results by using, e.g.,
$ mule.postprocessing.plot.sphere2d.grid output_prog_phi_pert_t00000129600.00000000.sweet
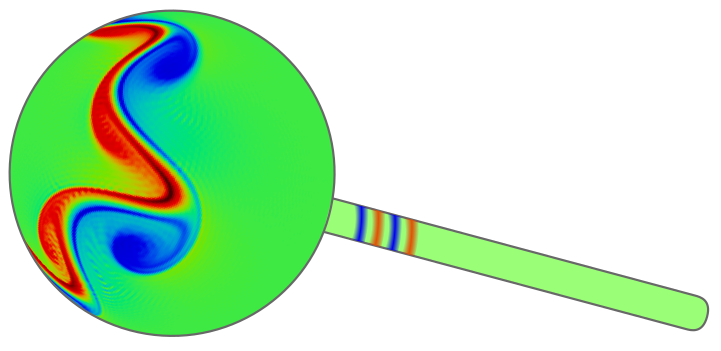
This will render the results using matplotlib.
All mule.* commands are part of the MULE feature within SWEET. There’s a separate tutorial about this.
 SWEET - Shallow Water Equation Environment for Tests, Awesome!